brain of mat kelcey...
e11.3 at what time does the world tweet?
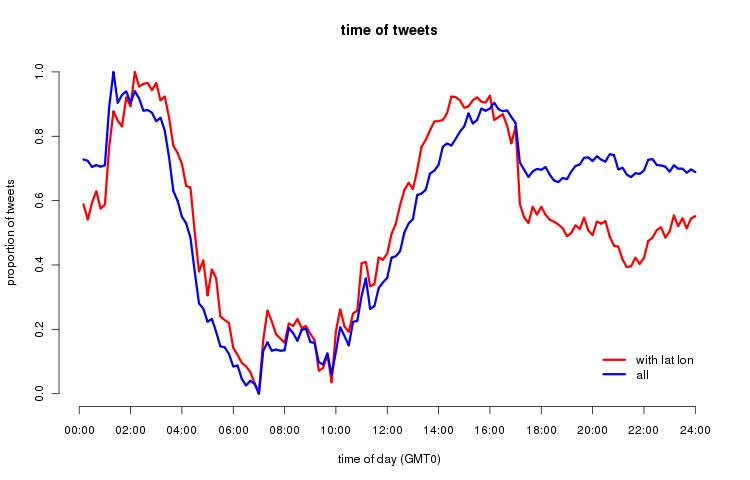
October 28, 2009 at 09:22 PM | categories: Uncategorizedconsider the graph below which shows the proportion of tweets per 10 min slot of the day (GMT0)
it compares 4.7e6 tweets with any location vs 320e3 tweets with identifiable lat lons

some interesting observations with unanswered questions...
- the ebb and flow is not just a result of the time of day for high twitter traffic areas. the reduction between 06:00 and 10:00 comes close to zero. this is false, there is never a worldwide time when internet traffic hits zero. does twitter turn down it's gatdenhose for capacity reasons?
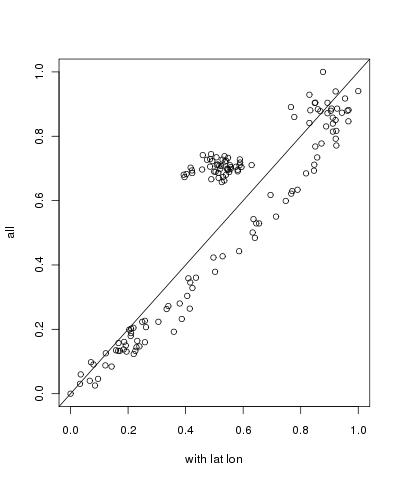
- the number of tweets with lat lons are correlated to those without EXCEPT past 17:00 where the lat lon cases drop drastically. have a couple of ideas banging around my head why this is the case but nothing concrete. any ideas?


