brain of mat kelcey...
e11.2 aggregating tweets by time of day
October 24, 2009 at 01:02 PM | categories: Uncategorizedfor v3 lets aggregate by time of the day, should make for an interesting animation
browsing the data there are lots of other lat longs in data, not just iPhone: and ÜT: there are also one tagged with Coppó:, Pre:, etc perhaps should just try to take anything that looks like a lat long.
furthermore lets switch to a bigger dataset again, 4.7e6 tweets from Oct 13 07:00 thru Oct 19 17:00,
i've been streaming all my tweets ( as previously discussed ) and been storing them in a directory json_stream
here are the steps...
1. extract locations
use a streaming script to take a tweet in json form and emit the tweet time and location string
export HADOOP_STREAMING_JAR=$HADOOP_HOME/contrib/streaming/hadoop-*-streaming.jar
hadoop jar $HADOOP_STREAMING_JAR \
 -mapper ./extract_locations.rb -reducer /bin/cat \
 -input json_stream -output locations
sample output (4.7e6 tuples) { time, location string }
Wed Oct 14 22:01:41 +0000 2009    iPhone: -23.492420,-46.846916
Wed Oct 14 22:01:41 +0000 2009    Ottawa
Wed Oct 14 22:01:41 +0000 2009    DA HOOD
Wed Oct 14 22:01:42 +0000 2009    Earth
2. pluck lat longs from locations
make another pass and extract possible lat lons from the location strings
hadoop jar $HADOOP_STREAMING_JAR \
 -mapper ./extract_lat_longs_from_locations.rb -reducer /bin/cat \
 -input locations -output lat_lons
sample output (reduces down to 320e3 data points) { time, lat, lon }
Wed Oct 14 22:01:41 +0000 2009    -23.49242    -46.846916
Wed Oct 14 22:05:25 +0000 2009    35.670086    139.740766
Wed Oct 14 22:11:35 +0000 2009    41.37731257    -74.68153942
Wed Oct 14 22:15:18 +0000 2009    51.503212    5.478329
3. bucket data into timeslices and points for a map
we need to project the times into 10min slots; ie 00:05 will be slot 0, 00:12 will be slot 1.
also use to project the lat lons to x and y coords (0->1) using a simple mercator projection
hadoop jar $HADOOP_STREAMING_JAR \
 -mapper ./lat_long_to_merc_and_bucket.rb -reducer /bin/cat \
 -cmdenv BUCKET_SIZE=0.005 \
 -input lat_lons -output x_y_points
sample output { timeslice, normalised x position, normalised y position }
122     0.48    0.205
122     0.295   0.26
122     0.29    0.26
123     0.265   0.265
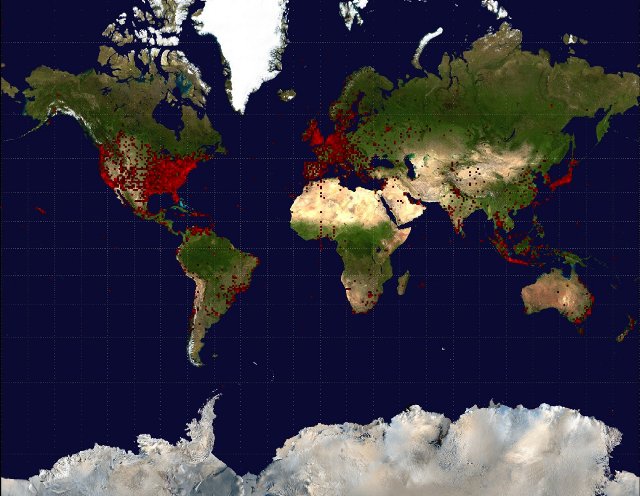
as a slight digression before we move onto aggregating per timeslice here's a pic of all 320e3 tweets on a heatmap.
some interesting noise on the greenwich meridian, must be incorrectly identified lat lons during the ./extract_lat_longs_from_locations.rb step.
log10 tweet location (click for a hires version)
4. aggregate (x,y) pairs per timeslice
next we aggreate, per timeslice, the frequency of points each x,y point. we'll do this with a pig script, aggregate_per_timeslice.pig
# aggregating per timeslice
pts = load 'x_y_points/part-00000' as (timeslice:int, x:float, y:float);
pts2 = group pts by (timeslice,x,y);
pts3 = foreach pts2 generate $0, COUNT($1) ;
pts4 = foreach pts3 generate $0.$0, $0.$1, $0.$2, $1 as freq;
pts5 = order pts4 by timeslice;
store pts5 into 'aggregated_freqs';
results in the tuples in 'aggregated_freqs' { timeslice, normalised x position, normalised y position, frequency }
0    0.0    0.32    1
0    0.06    0.325    9
0    0.065    0.33    1
0    0.08    0.17    2
0    0.155    0.225    8
we need to normalise each frequency value for drawing on the map and would have like to have done this in pig also but turns out there isn't a log function in v0.3 of pig (??)
will have to do scaling when generating the images. isn't such a big deal since the dataset is quite small at this stage but was trying to use this whole thing as an excuse to learn pig :(
5. take aggregated_freqs and make 144 heat map images
use a simple script to read through the aggregated_freqs and generate a heap map for each frame
heat_maps.rb aggregated_freqs 0.005 frames
6. convert to animation
next bundle stills into an animation and upload to youtube
mencoder mencoder "mf://frames/*" -mf fps=25 -o rtw_tweet_v3.avi -ovc x264 -x264encopts bitrate=750
7. conclusions
- didn't really end up using hadoop's power that much; streaming jobs that use just cat as a reducer as just a parallel way of doing 1:1 string mapping
- aggregation was really easy in pig but lack of Log function is annoying; could have written a UDF, and there probably already is one but i couldn't find it
- this visualisation came out pretty lame; funny to see how the really swish visualisations rely far more on pretty colours and smooth lines than the data itself. there are a bundle of things i could do with this one but it's time to move on to something else.


