


brain of mat kelcey...
dimensionality reduction using random projections.
May 10, 2011 at 08:31 PM | categories: Uncategorizedpreviously i've discussed dimensionality reduction using SVD and PCA but another interesting technique is using a random projection.
in a random projection we project A (a NxM matrix) to A' (a NxO, O < M) by the transform AP=A' where P is a MxO matrix with random values. ( well not totally random, each column must have unit length (ie entries in each column must add to 1) )
though the results of this reduction are generally not as good as the results from SVD or PCA it has two huge benefits
- can be done without needing to hold P in memory (since it's entries can be generated multiple times using a seeded RNG)
- and more importantly it's really fast
how good is it compared to PCA i wonder? let's have a play around...
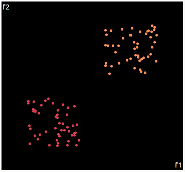
consider the 2d dataset of two clear clusters of points around (2,2) and (8,8)
the following shows 5 random projections to 1d compared to a 1d PCA reduction (done using weka)
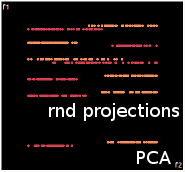
there was a clear seperation between the 2 classes in 2d and it's retained in 3 out of the 5 projections even though we're using half the space going from 2d to 1d. ( the 2nd random projection actually looks very similiar to PCA )
what about some higher dimensions?
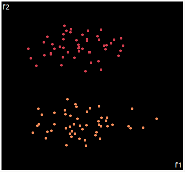
let's generate the same two clusters but in 10d; ie around the points (2,2,2,2,2,2,2,2,2,2) and (8,8,8,8,8,8,8,8,8,8)
though we can't plot this easily there are 2 useful visualisations of the data
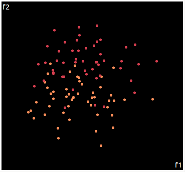
a scatterplot, which is pretty uninteresting actually...
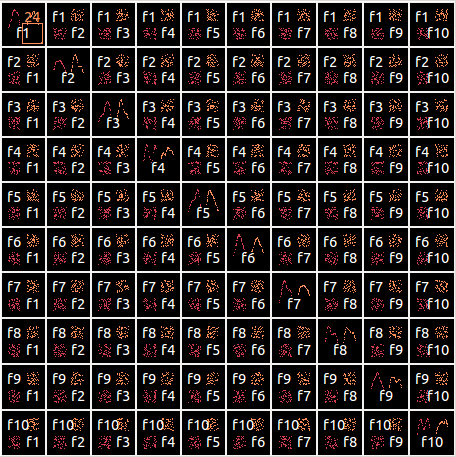
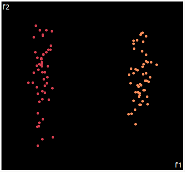
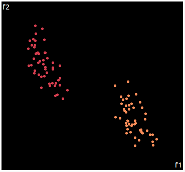
or a 2d tour through the 10d space
(check out my screencast on ggobi if you're after a better idea of what this tour represents)
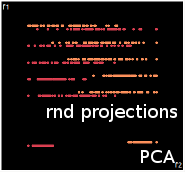
lets compare 5 random projections to PCA when projecting from 10d to 1d this time not so good... only one projection gets the clusters seperated, and only just.
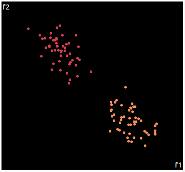
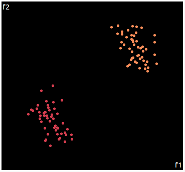
what about projecting to 2d?
| PCA | run1 | run2 | run3 | run4 | run5 |
 |
 |
 |
 |
 |
 |
PCA is by the cleanest with the x-axis representing the clusters and the y-axis representing the in cluster variance. it clearly shows how the dataset can be projection to 1d, we only needed the first (x-axis) principal component.
the projections aren't too bad, all but 1 of them has the 2 clusters linearly seperable.
so in summary i think it's pretty good if you need to do something super fast. in these experiments i was using a pretty contrived dataset but was trying to be quite aggressive in going from 10d to 1d.
i wonder what, if any, difference there would be with sparse data?
< random evening hackery />