| f1 | f2 | f3 | f4 | |
| d1 | 4.123 | 0.000 | 0.000 | 0.000 |
| d2 | 4.123 | 0.000 | 0.000 | 0.000 |
| d3 | 0.000 | -3.000 | 0.000 | 0.000 |
| d4 | 0.000 | -3.000 | 0.000 | 0.000 |
here's another trivial example to make sure we know exactly what's going on
consider the set of, again, extremely contrived documents
d1: c a a b c b c
d2: a b c a b c c
d3: d e f f d
d4: f d e d f
which is represented as the 6x4 document term matrix.
| d1 | d2 | d3 | d4 | |
| a | 2 | 2 | 0 | 0 |
| b | 2 | 2 | 0 | 0 |
| c | 3 | 3 | 0 | 0 |
| d | 0 | 0 | 2 | 2 |
| e | 0 | 0 | 1 | 1 |
| f | 0 | 0 | 2 | 2 |
once more we can see two clear clusterings of the documents; d1 with d2 and d3 with d4
the singular value decomposition is a matrix decomposition algorithm (ie it breaks a matrix up into a series of products of matrices)
in particular the SVD decomposes a matrix A into the produce of three specially formed matrices (mysteriously named) U, S and V
each of these three matrices represents a different interpretation of the original data.
here is a decomposition of A performed using SVDLIBC
| d1 | d2 | d3 | d4 | |
| a | 2 | 2 | 0 | 0 |
| b | 2 | 2 | 0 | 0 |
| c | 3 | 3 | 0 | 0 |
| d | 0 | 0 | 2 | 2 |
| e | 0 | 0 | 1 | 1 |
| f | 0 | 0 | 2 | 2 |
| f1 | f2 | f3 | f4 | |
| a | 0.48 | 0 | 0 | 0 |
| b | 0.48 | 0 | 0 | 0 |
| c | 0.72 | 0 | 0 | 0 |
| d | 0 | -0.66 | 0 | 0 |
| e | 0 | -0.33 | 0 | 0 |
| f | 0 | -0.66 | 0 | 0 |
| f1 | f2 | f3 | f4 | |
| f1 | 5.83 | 0 | 0 | 0 |
| f2 | 0 | 4.24 | 0 | 0 |
| f3 | 0 | 0 | 0 | 0 |
| f4 | 0 | 0 | 0 | 0 |
| d1 | d2 | d3 | d4 | |
| f1 | 0.70 | 0.38 | 0 | 0 |
| f2 | 0 | 0 | -0.70 | -0.70 |
| f3 | 0 | 0 | 0 | 0 |
| f4 | 0 | 0 | 0 | 0 |
S describes the relative strengths of the features U describes the relationship between terms (rows) and features (columns) Vt describes the relationshop between features (rows) and documents (columns) even though the decomposition is expressed in terms of V transpose we'll usually talk about V so that the features are the columns in both U and V
the matrix S is always a diagonal matrix with non-negative decending values, formally known as the singular values
each non zero value represents a feature and in this example we have two. (there can't be more features than there are documents) the magnitude of the values describes how much variance each feature describes in the data for this example we can see that each feature is roughly the same strength; there are roughly the same number of documents for each feature
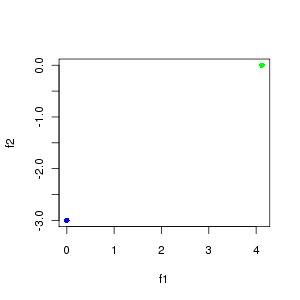
the matrix product VS describes the relation between documents (VS's rows) and the features (VS's columns)
plotting f1 vs f2 we can see the expected seperation of doc1 and doc2 from doc3 and doc4
| f1 | f2 | f3 | f4 | |
| d1 | 4.123 | 0.000 | 0.000 | 0.000 |
| d2 | 4.123 | 0.000 | 0.000 | 0.000 |
| d3 | 0.000 | -3.000 | 0.000 | 0.000 |
| d4 | 0.000 | -3.000 | 0.000 | 0.000 |
the matrix product US describes the relation between terms (US's rows) and the features (US's columns)
again we see what we expected; terms a, b & c (only present in the first two documents) are aligned with feature 1 whereas terms d, e & (only present in the second two documents) are aligned with feature 2 we can also see that c has a stronger association with feature 1 than a or b does denoting that c occured more frequently likewise e has a weaker association with feature 2 than d or e does denoting that e occured less frequently
| f1 | f2 | f3 | f4 | |
| a | 2.82 | 0 | 0 | 0 |
| b | 2.82 | 0 | 0 | 0 |
| c | 4.24 | 0 | 0 | 0 |
| d | 0 | -2.82 | 0 | 0 |
| e | 0 | -1.41 | 0 | 0 |
| f | 0 | -2.82 | 0 | 0 |
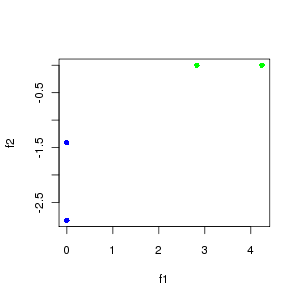
let's now look at slighty more complex example
Aug 2009 me on twitter me on google+