| f1 | f2 | f3 | f4 | |
| d1 | 3.502 | -2.159 | -0.273 | 0.000 |
| d2 | 2.724 | -2.111 | 0.353 | 0.000 |
| d3 | 3.755 | 1.956 | -0.278 | 0.000 |
| d4 | 2.977 | 2.005 | 0.349 | 0.000 |
<< example 1 index example 3 >>
here's a slightly more complex example to work with
consider the documents
d1: c a a b c b c
d2: a b c a b c c
d3: d e c f c f d c
d4: c c f d e d f
which are represented as the 6x4 document term matrix.
| d1 | d2 | d3 | d4 | |
| a | 2 | 2 | 0 | 0 |
| b | 2 | 2 | 0 | 0 |
| c | 3 | 2 | 3 | 2 |
| d | 0 | 0 | 2 | 2 |
| e | 0 | 0 | 1 | 1 |
| f | 0 | 0 | 2 | 2 |
once more we can see a partitioning of the documents; d1 with d2 and d3 with d4 like our original example it's not as clear cut since c is present in d1 and d2 as much as it is in d3 and d4.
here is a decomposition of A performed using SVDLIBC
| d1 | d2 | d3 | d4 | |
| t1 | 2 | 2 | 0 | 0 |
| t2 | 2 | 2 | 0 | 0 |
| t3 | 3 | 2 | 3 | 2 |
| t4 | 0 | 0 | 2 | 2 |
| t5 | 0 | 0 | 1 | 1 |
| t6 | 0 | 0 | 2 | 2 |
| f1 | f2 | f3 | f4 | |
| t1 | 0.292 | -0.503 | 0.402 | 0.000 |
| t2 | 0.292 | -0.503 | 0.402 | 0.000 |
| t3 | 0.778 | -0.048 | -0.626 | 0.000 |
| t4 | 0.316 | 0.467 | 0.356 | 0.000 |
| t5 | 0.158 | 0.233 | 0.178 | 0.000 |
| t6 | 0.316 | 0.467 | 0.356 | 0.000 |
| f1 | f2 | f3 | f4 | |
| f1 | 6.52 | 0 | 0 | 0 |
| f2 | 0 | 4.11 | 0 | 0 |
| f3 | 0 | 0 | 0.63 | 0 |
| f4 | 0 | 0 | 0 | 0 |
| d1 | d2 | d3 | d4 | |
| f1 | 0.536 | 0.417 | 0.575 | 0.456 |
| f2 | -0.524 | -0.513 | 0.475 | 0.487 |
| f3 | -0.433 | 0.560 | -0.440 | 0.553 |
| f4 | 0.398 | 16.962 | 42.639 | 0.000 |
recall: S describes the relative strengths of the features U describes the relationship between terms (rows) and features (columns) Vt describes the relationshop between features (rows) and documents (columns) even though the decomposition is expressed in terms of V transpose we'll usually talk about V so that the features are the columns in both U and V
this time we have 3 singular values; 2 dominant ones (f1 and f2) and 1 lesser one (f3) so again the variance of this data is primarily described by 2 features
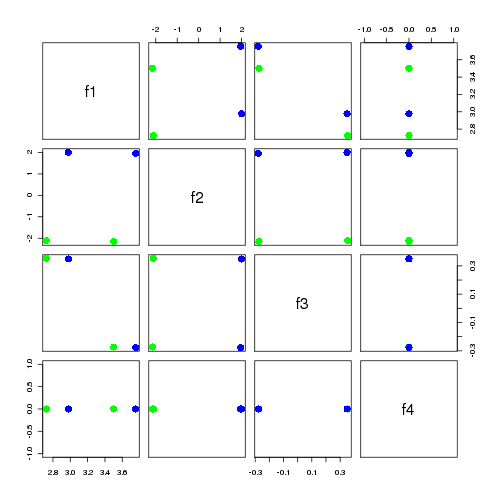
recall the matrix product VS describes the relation between documents (VS's rows) and the features (VS's columns)
it's not as straight forward as our the last example this time the dominant feature f1 describes not a type of document but the use of the common term c it's f2 that gives a clear seperation of d1 and d2 from d3 and d4 the scatterplot matrix below seems to suggest in this case that f2 alone is the best distinguisher of the two types of documents.
| f1 | f2 | f3 | f4 | |
| d1 | 3.502 | -2.159 | -0.273 | 0.000 |
| d2 | 2.724 | -2.111 | 0.353 | 0.000 |
| d3 | 3.755 | 1.956 | -0.278 | 0.000 |
| d4 | 2.977 | 2.005 | 0.349 | 0.000 |
recall the matrix product US describes the relation between terms (US's rows) and the features (US's columns)
as above we see that the strongest feature f1 is primarily related to the term c f2 gives a reasonable seperation for the 3 types of terms in the corpus;
| f1 | f2 | f3 | f4 | |
| a | 1.907 | -2.074 | 0.253 | 0.000 |
| b | 1.907 | -2.074 | 0.253 | 0.000 |
| c | 5.080 | -0.200 | -0.395 | 0.000 |
| d | 2.062 | 1.923 | 0.225 | 0.000 |
| e | 1.031 | 0.962 | 0.112 | 0.000 |
| f | 2.062 | 1.923 | 0.225 | 0.000 |
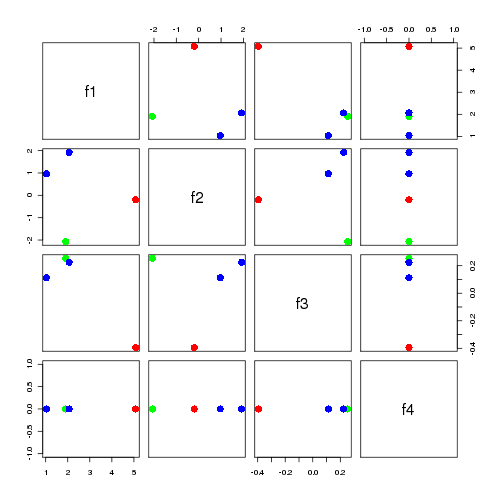
where as the first example was a simple case of 1 feature = 1 type of document, it's more complex this time the first feature instead describes the use of a very common term which apparently is quite common. the highest features often relate to language semantics, with later features describing corpus structure
let's move onto an even more complex example
<< example 1 index example 3 >>
Aug 2009 me on twitter me on google+