recall: S describes the relative strengths of the features U describes the relationship between terms (rows) and features (columns) Vt describes the relationshop between features (rows) and documents (columns)
interpretation of S
similiarly to our last example we've got two dominant features but the additional non zero term frequencies have meant we've got variance for all possible 4 features. (this is representive of the general non contrived case where if we were dealing with a large number of documents we'd only be interested in the first dominant features) like last time since the first two values are much higher than the second two we can derive that there are two main dominant features in the corpus.
interpretation of VS
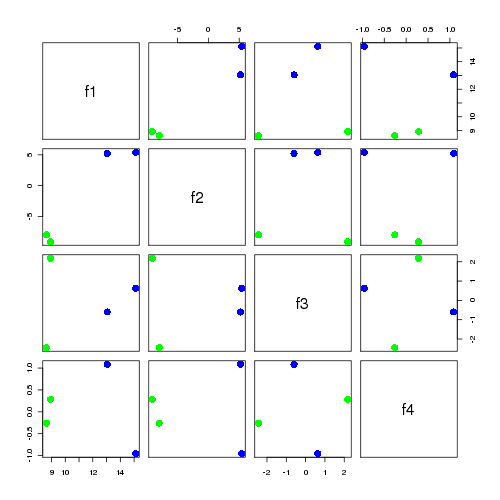
the matrix product VS describes the relation between documents (VS's rows) and the features (VS's columns)
| f1 | f2 | f3 | f4 | |
| d1 | 8.624 | -7.973 | -2.447 | -0.259 |
| d2 | 8.928 | -9.081 | 2.177 | 0.283 |
| d3 | 15.116 | 5.402 | 0.627 | -0.956 |
| d4 | 13.044 | 5.227 | -0.599 | 1.086 |
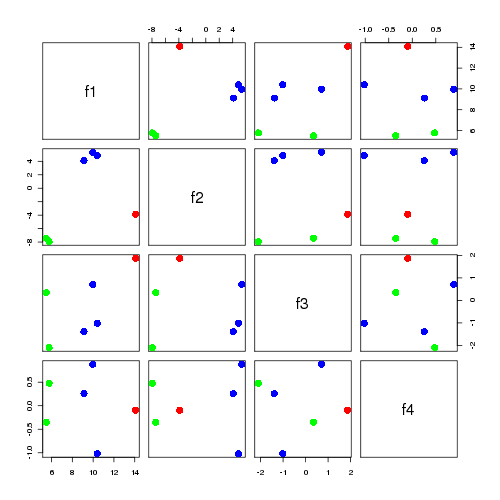
interpretation of US
the matrix product US describes the relation between terms (US's rows) and the features (US's columns) there is a bit more jitter in the points but similiar analysis as last time holds
| f1 | f2 | f3 | f4 | |
| a | 5.502 | -7.449 | 0.349 | -0.352 |
| b | 5.768 | -7.943 | -2.100 | 0.477 |
| c | 14.091 | -3.864 | 1.869 | -0.095 |
| d | 9.962 | 5.337 | 0.709 | 0.880 |
| e | 10.404 | 4.867 | -1.016 | -1.019 |
| f | 9.118 | 4.107 | -1.386 | 0.259 |
ok then, enough of this contrived stuff, let's have a look at an example with real data