brain of mat kelcey...
e11.1 from bash scripts to hadoop
October 18, 2009 at 02:10 PM | categories: Uncategorizedlet's rewrite v1 using hadoop tooling, code is on github
we'll run hadoop in non distributed standalone mode. in this mode everything runs in a single jvm so it's nice and simple to dev against.
step 1: extract the locations strings from the json stream
in v1 it was
bzcat sample.bz2 | ./extract_locations.pl > locations
using the the awesome hadoop streaming interface it's not too different. this interface allows you to specify any app as the mapper or reducer. the main difference is that it works on directories not just files.
for the mapper we'll use exactly the same script as before; extract_locations.pl and since there is no reduce component of this job so we use an "identity" script, ie cat, as the reduce phase.
mkdir json_stream
bzcat sample.bz2 | gzip - > json_stream/input.gz
# hadoop supports gzip out of the bound but not bzip2 :(
export HADOOP_STREAMING_JAR=$HADOOP_HOME/contrib/streaming/hadoop-*-streaming.jar
hadoop jar $HADOOP_STREAMING_JAR \
  -mapper ./extract_locations.pl -reducer /bin/cat \
  -input json_stream -output locations
this gives us the locations in a single file locations/part-0000
step 2: extract iphone and ut lat longs strings
the second step is another text munging problem where we extract just the lat longs for the iPhone and UT tagged locations
ie for strings of the form
iPhone: 21.320328,-157.877579
\u00dcT: 41.727877,-91.626323
we want to extract
21.320328 -157.877579
41.727877 -91.626323
since this is just text manipulation we'll use streaming again
in v1 it was
cat locations | ./extract_lat_longs_from_locations.rb iphone > locations.iphone
cat locations | ./extract_lat_longs_from_locations.rb ut > locations.ut
for hadoop streaming it's
hadoop jar $HADOOP_STREAMING_JAR \
  -mapper './extract_lat_longs_from_locations.rb iphone' -reducer /bin/cat \
  -input locations -output locations.iphone
hadoop jar $HADOOP_STREAMING_JAR \
  -mapper './extract_lat_longs_from_locations.rb ut' -reducer /bin/cat \
  -input locations -output locations.ut
step 3: convert from lat long to mercator coordinates and aggregate into buckets for the heat map
in v1 it was
cat locations.{ut,iphone} | ./lat_long_to_merc.rb | ./bucket.rb | sort | uniq -c
this converts the three tuples { lat, long }
35.670086 139.740766
-23.492420 -46.846916
35.657570 139.744858
into two tuples { frequency, left-offset, top-offset }
1 0.36 0.45
2 0.88 0.28
the first two parts, converting to mercator (lat_long_to_merc.rb) and the bucketing (bucket.rb), i'll combine into one script.
hadoop jar $HADOOP_STREAMING_JAR \
  -mapper ./lat_long_to_merc_and_bucket.rb -reducer /bin/cat \
  -input locations.iphone -input locations.ut -output x_y_points
but the use of sort and uniq to aggregate the data is represented by the shuffle and reduce stages of hadoop.
we could use the aggregate functionality of the streaming interface but i'm trying to learn more pig so we'll use that instead. pig is a scripting language that translates a pig latin query language into map reduce jobs. my main motivation for using it has been that it's great at doing joins, something i've found to be a big pain to represent in plain map reduce jobs.
( note we didn't do the conversion to mercator and bucketing in pig, the arithmetic operations provided are a bit lacking. )
enter a pig shell running in standalone (ie non hadoop distributed) mode
bash> pig -x local
load the points
grunt> pts = load 'x_y_points/part-00000' as (x:float, y:float);
grunt> describe pts;
pts: {x: float,y: float}
grunt> dump pts
(0.06F,0.32F)
(0.15F,0.27F)
(0.16F,0.27F)
...
group them together
grunt> buckets = group pts by (x,y);
grunt> describe buckets;
buckets: {group: (x: float,y: float),pts: {x: float,y: float}}
grunt> dump buckets;
((0.06F,0.32F),{(0.06F,0.32F)})
((0.15F,0.27F),{(0.15F,0.27F)})
((0.16F,0.27F),{(0.16F,0.27F),(0.16F,0.27F),(0.16F,0.27F),(0.16F,0.27F)})
...
from the groups emit the size of each bucket, this corresponds to the frequency
grunt> freq = foreach buckets { generate group, SIZE(pts) as size; }
grunt> describe freq;
freq: {group: (x: float,y: float),size: long}
grunt> dump freq
((0.06F,0.32F),1L)
((0.15F,0.27F),1L)
((0.16F,0.27F),4L)
...
and based on the sizes we can evaluate the min and max frequencies which we'll use in the colour coding of the heat map
grunt> freqs = group freq all;
grunt> describe freqs;
freqs: {group: chararray,freq: {group: (x: float,y: float),size: long}}
grunt> dump freqs;
(all,{((0.06F,0.32F),1L),((0.15F,0.27F),1L), ... })
grunt> store freq into 'freqs';</pre>
<pre>grunt> min_max = foreach freqs { generate MAX(freq.size) as max, MIN(freq.size) as min; };
grunt> describe min_max;
min_max: {max: long,min: long}
grunt> dump min_max;
(7L,1L)
grunt> store min_max into 'min_max';</pre>
<pre>bash> cat freqs
(0.06,0.32)   1
(0.15,0.27)   1
(0.16,0.27)   4
these call all be run as one command
bash> pig -x local -f freqs.pig
we just need our final conversion to a javascript snippet to jam into a map page
bash> cat freqs | ./as_draw_square.rb 1 7
win!
to make things a little different lets use a bigger sample of 475e3 tweets from oct 13 07:00 to 20:00. this results in 10e3 iphone locations (7e3 unique) and 22e3 ut locations (15e3 unique)
lat longs are bucketed into only 478 pixels for map
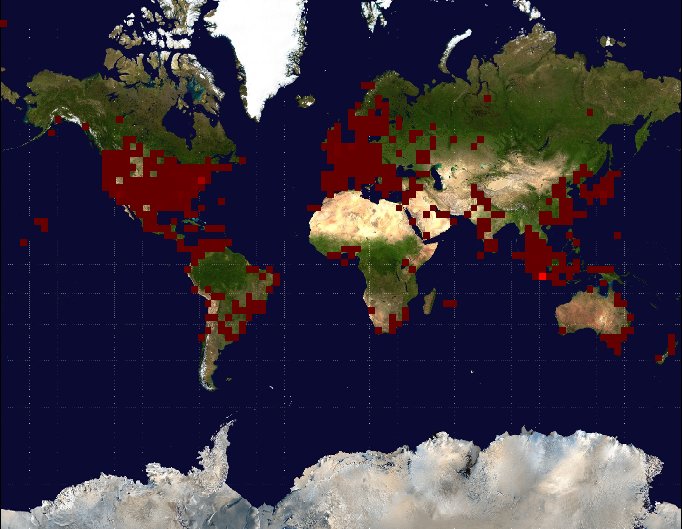
here's one plot with the raw numbers; highest freq is 9e3 in jakarta
raw frequencies

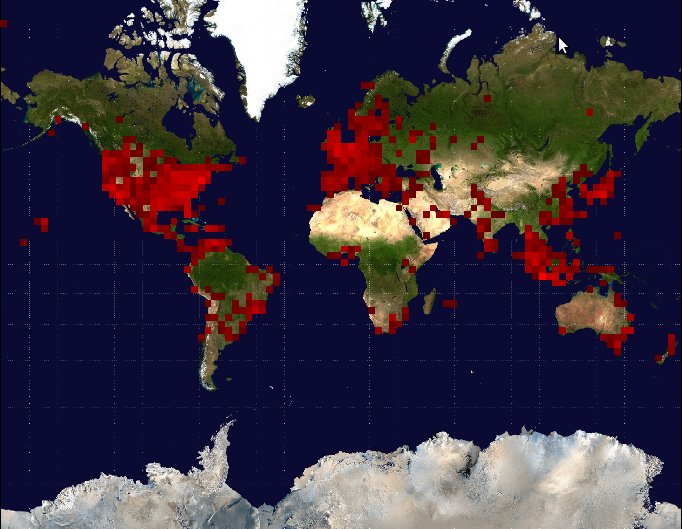
scaling down by log 10 gives a smoother map
log10 frequencies

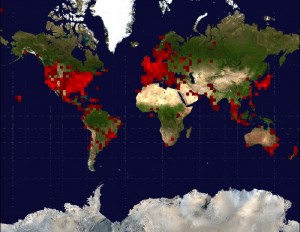
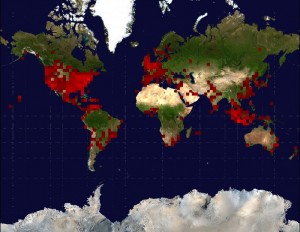
and here is a comparison of iphone vs ut. without knowing what ut is i can see it's not big in northern europe or japan but it's popular in indonesia.
iphones

ut

next steps, animating based on the hour of the day


