brain of mat kelcey...
ggplot posixct cheat sheet
March 18, 2012 at 08:00 PM | categories: Uncategorizedggplot posixct cheat sheet
after having to google this stuff three times in the last few months i'm writing it down here so i can just cut and paste next time...
data with arbitrary date time stamp
> d = read.delim('data.tsv',header=F,as.is=T,col.names=c('dts_str','freq'))
> # YEAR MONTH DAY HOUR
> head(d,3)
        dts_str  freq
1 2012_01_01_00 18393
2 2012_01_01_01 20536
3 2012_01_01_02 91840
> tail(d,3)
          dts_str   freq
732 2012_01_31_21 103107
733 2012_01_31_22 108921
734 2012_01_31_23  78629
> summary(d$freq)
   Min. 1st Qu.  Median    Mean 3rd Qu.    Max.
  10590   63620   82680   86770  105700  169900
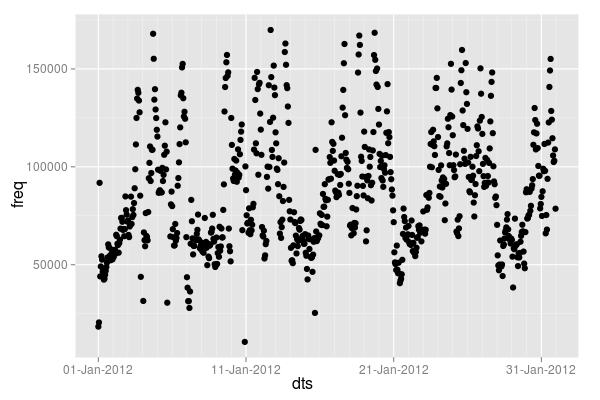
parse arbitrary strange format to a datetime
> d$dts = as.POSIXct(d$dts_str, format="%Y_%m_%d_%H")

> head(d,3)
        dts_str  freq                 dts
1 2012_01_01_00 18393 2012-01-01 00:00:00
2 2012_01_01_01 20536 2012-01-01 01:00:00
3 2012_01_01_02 91840 2012-01-01 02:00:00

> ggplot(d, aes(dts, freq)) + geom_point() + scale_x_datetime(major="10 days", minor="1 day", format="%d-%b-%Y")
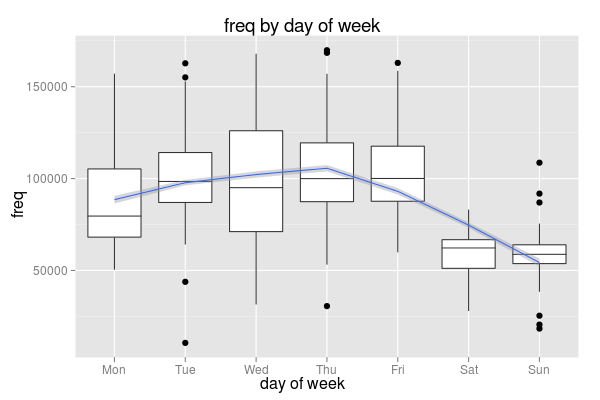
plots by day of week; summary
> d$dow = as.factor(format(d$dts, format="%a"))  # day of week
> head(d,3)
        dts_str  freq                 dts dow
1 2012_01_01_00 18393 2012-01-01 00:00:00 Sun
2 2012_01_01_01 20536 2012-01-01 01:00:00 Sun
3 2012_01_01_02 91840 2012-01-01 02:00:00 Sun
> ggplot(d,aes(dow,freq))
 + geom_boxplot()
 + geom_smooth(aes(group=1))
 + scale_x_discrete(limits=c('Mon','Tue','Wed','Thu','Fri','Sat','Sun')) # provide explicit factor ordering
 + xlab('day of week') + ylab('freq') + opts(title='freq by day of week')
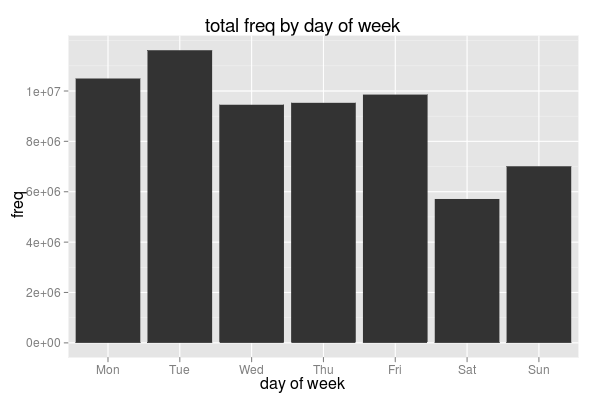
plots by day of week; totals
> by_dow = ddply(d, "dow", summarize, freq=sum(freq))
> ggplot(by_dow,aes(dow,freq)) + geom_bar() +
 scale_x_discrete(limits=c('Mon','Tue','Wed','Thu','Fri','Sat','Sun')) +
 xlab('day of week') + ylab('freq') + opts(title='total freq by day of week')
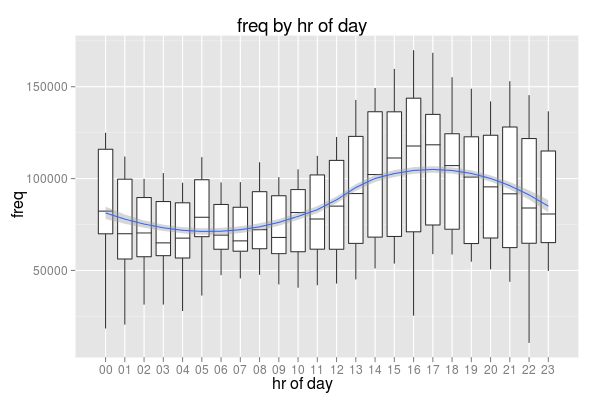
plots by hour of day; summary
> d$hr = format(d$dts, format="%H")
> head(d,3)
        dts_str  freq                 dts dow hr
1 2012_01_01_00 18393 2012-01-01 00:00:00 Sun 00
2 2012_01_01_01 20536 2012-01-01 01:00:00 Sun 01
3 2012_01_01_02 91840 2012-01-01 02:00:00 Sun 02
> ggplot(d,aes(hr,freq)) + geom_boxplot() + geom_smooth(aes(group=1)) +
 xlab('hr of day') + ylab('freq') + opts(title='freq by hr of day')
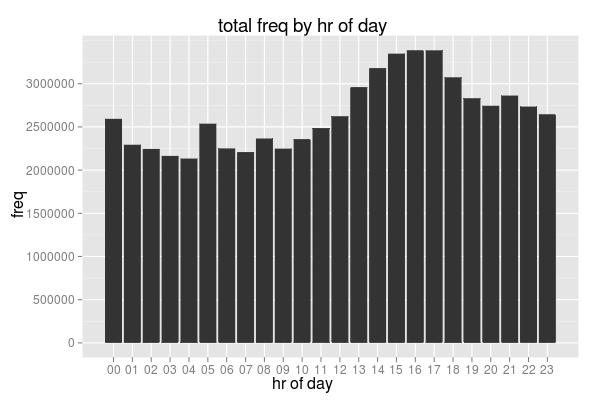
plots by hour of day; totals
> by_hr = ddply(d, "hr", summarize, freq=sum(freq))
> ggplot(by_hr,aes(hr,freq)) + geom_bar() +
 xlab('hr of day') + ylab('freq') + opts(title='total freq by hr of day')
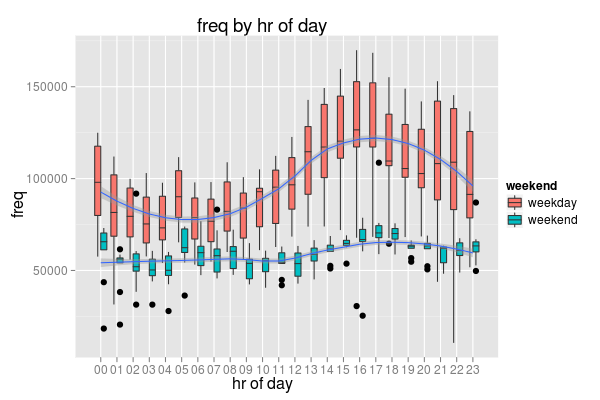
seperate weekday from weekend
d$weekend = 'weekday'
d[d$dow=='Sat'|d$dow=='Sun',]$weekend = 'weekend' # terrible style :(
ggplot(d,aes(hr,freq))
 + geom_boxplot(aes(fill=weekend))
 + geom_smooth(aes(group=weekend))
 + xlab('hr of day') + ylab('freq') + opts(title='freq by hr of day')