


brain of mat kelcey...
ggplot posixct cheat sheet
March 18, 2012 at 08:00 PM | categories: Uncategorized
after having to google this stuff three times in the last few months i'm writing it down here so i can just cut and paste next time...> d = read.delim('data.tsv',header=F,as.is=T,col.names=c('dts_str','freq'))> # YEAR MONTH DAY HOUR> head(d,3) ...
collocations in wikipedia, part 1
January 01, 2012 at 08:00 PM | categories: Uncategorized
hmmm. did you mean collocations in wikipedia?...
tokenising the visible english text of common crawl
December 10, 2011 at 04:00 PM | categories: Uncategorized
Common crawl is a publically available 30TB web crawl taken between September 2009 and September 2010. As a small project I decided to extract and tokenised the visible text of the web pages in this dataset. All the code to...
finding phrases with mutual information
November 15, 2011 at 11:00 PM | categories: Uncategorized
continuing on with my series of mutual information experiments how might we extend the technique to identity sequences longer than just two terms?one novel way is to identify the bigrams of interest, replace them with a single token and simply...
collocations in wikipedia, part 2
November 05, 2011 at 05:00 PM | categories: Uncategorized
in my last post we went through mutual information as a way of finding collocations.the astute reader may have noticed that for the list of top bigrams i onlyshowed ones that had a frequency above 5,000.why this cutoff? well it...
collocations in wikipedia, part 1
October 19, 2011 at 08:00 PM | categories: Uncategorized
collocations are combinations of terms that occur together more frequently thanyou'd expect by chance. they can include proper noun phrases like 'Darth Vader'stock/colloquial phrases like 'flora and fauna' or 'old as the hills'common adjectives/noun pairs (notice how 'strong coffee' sounds...
an exercise in handling mislabelled training data
October 03, 2011 at 08:00 PM | categories: Uncategorized
as part of my diy twitter client project i've been using the twitter sample streams as a sourceof unlabelled data for some mutual information analysis. these streams are a great source of random tweets but include a lot of non...
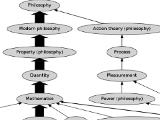
do all first links on wikipedia lead to philosophy?
August 13, 2011 at 03:00 PM | categories: projects
using hadoop and a wikipedia dump to test the hypothesis that all first links on pages eventually lead to philosophy.
dimensionality reduction using random projections.
May 10, 2011 at 08:31 PM | categories: Uncategorized
previously i've discussed dimensionality reduction using SVD and PCA but another interesting technique is using a random projection.in a random projection we project A (a NxM matrix) to A' (a NxO, O < M) by the transform AP=A' where P...
pseudocounts and the good-turing estimation (part1)
April 03, 2011 at 03:04 PM | categories: Uncategorized
say we are running the bar at a soldout bad religion concert. the bar serves beer, scotch and water and we decide to record orders over the night so that we can know how much to order for tomorrow's gig...drink#salesbeer1000scotch300water200using...
visualising the consistent hash
September 26, 2010 at 04:00 PM | categories: Uncategorized
consider the problem of allocating N resources across M servers (N >> M)a common approach is the straight forward modulo hash...if we have 4 servers; servers = [server0, server1, server2, server3] we can allocate a resource to a server by...
simple text search in ruby using ferret
September 12, 2010 at 09:28 PM | categories: Uncategorized
ferret is a lightweight text search engine for ruby, a bit like lucene but with less (ie no) java.i've been looking at it today as part of my named entity extraction prototype which needs to be able to fuzzily match...
my list of cool machine learning books
August 06, 2010 at 06:35 PM | categories: Uncategorized
for the last month or so i've had my head down and have been focusing more on theory (ie reading) than on practice (ie coding)so rather than write no blog post here's mats-list-of-cool-machine-learning-books in the order i think you should...
brutally short intro to weka
July 03, 2010 at 05:35 PM | categories: Uncategorized
weka is a java based machine learning workbench that i've found useful to playing with to help understand some standard machine learning algorithms. in this quick demo i show how to build a classifier for three simple datasets; two of...
friend clustering by term usage
June 25, 2010 at 11:39 PM | categories: Uncategorized
recently signed up to the infochimps api and wanted to do something quick and dirty to get a feel for it.so here's a little experimentget the people i follow on twitterlook up the words that "represent" them according to the...
country codes in world cup tweets - viz1
June 21, 2010 at 07:43 PM | categories: Uncategorized
#worldcup tweet viz1 from Mat Kelcey on Vimeo.here's a simple visualisation of the use of official country codes (eg #aus) in a week's worth of tweets from the search stream for #worldcup.rate is about 2hours of tweets per sec. orb...
moving average of a time series in R
June 15, 2010 at 04:15 PM | categories: Uncategorized
in this a sliding window of 3 elements123456789> x = c(3,1,4,1,5,9,2,6,5,3,5,8)> ra_x = filter(x, rep(1,3)/3)> ra_xTime Series:Start = 1 End = 12 Frequency = 1 [1] NA 2.666667 2.000000 3.333333 5.000000 5.333333 5.666667...
#worldcup twitter analytics
June 14, 2010 at 10:06 PM | categories: Uncategorized
since the world cup started i've spent more time looking at twitter data about the games than the actual games themselves. what a sad data nerd i am!anyways, here's the first few days analysis based the use of official country...
a quick study in tf/icf
June 09, 2010 at 09:58 PM | categories: Uncategorized
while doing some more research on trending algorithms i came across a cool little paper about term frequency normalisation for streaming data: TF-ICF: A New Term Weighting Scheme for Clustering Dynamic Data Streams.i'm finding streaming related algorithms quite interesting lately...
5 minute ggobi demo
June 04, 2010 at 11:12 PM | categories: Uncategorized
brutally short demo of ggobi from Mat Kelcey on Vimeo.note: non embedded version has higher res at full screen...
how many terms in a trend?
May 11, 2010 at 07:46 PM | categories: Uncategorized
i've been poking around with a simple trending algorithm over the last few weeks and have uncovered a problem that, like most interesting ones, i'm not sure how to solve. the question revolves around discovering multi terms trends. a sensible...
trending topics in tweets about cheese; part2
May 01, 2010 at 04:54 PM | categories: Uncategorized
prototyping in ruby was a great way to prove the concept but my main motivation for this project was to play some more with pig.the main approach will bemaintain a relation with one record per tokenfold 1 hours worth of...
trending topics in tweets about cheese; part1
April 27, 2010 at 11:42 PM | categories: Uncategorized
what does it mean for a topic to be 'trending'? consider the following time series (430e3 tweets containingcheese collected over a month period bucketed into hourly timeslots)without a formal definition we can just look at this and say that the...
latent semantic analysis via the singular value decomposition (for dummies)
April 19, 2010 at 08:50 PM | categories: Uncategorized
i've been trying to get a deeper understanding of latent semantic analysis for awhile now.last week i came to the conclusion the other way to truly understand would be to start from the ground upso here goes; mat's guide to...
cool bash stuff; mkfifo
April 15, 2010 at 09:33 PM | categories: Uncategorized
mkfifo is one of those shell commands provided as part of coreutils that not many people seem to know about.here's an (semi contrived) example close to something i did the other day to show how awesome it issay you have...
e10.6 community detection for my twitter network
April 04, 2010 at 12:58 PM | categories: Uncategorized
last night i applied my network decomposition algorithm to a graph of some of the people near me in twitter.first i build a friend graph for 100 people 'around' me (taken from a crawl i did last year). by 'friend'...
e10.5 revisiting community detection
March 30, 2010 at 08:42 PM | categories: Uncategorized
i've decided to switch back to some previous work i did on community detection in (social) graphsthe last chunk of code i wrote which tried to deal with weighted directed graphs was terribly, terribly, broken but it seems that simplifying...
brutally short intro to collaborative filtering
March 18, 2010 at 08:38 PM | categories: Uncategorized
my favourite recommendations system is the collaborative filter; it gives good resultsand is easy to understand and extend as required.it works on the intuition thatif i like coffee, chocolate and ice creamand you like coffee and chocolateyou might also like...
sentiment analysis training data using mechanical turk
March 12, 2010 at 09:57 PM | categories: Uncategorized
want to try doing some sentiment analysis work on tweets but i need some good training data.i could label a heap of tweets myself as being positive, neutral or negative but instead this seems to be the perfect job for...
mongodb + twitter + yahoo term extractor = fun!
March 07, 2010 at 09:38 PM | categories: Uncategorized
ran a little experiment in using yahoo term extraction yesterday and it worked well enough. here's some code to pass some text to yahoo and get back an array of termsi've got to say mongodb is such an easy tool...
what to do with a week off?
February 22, 2010 at 06:42 PM | categories: Uncategorized
this week i'm between jobs so i have (a little) more time than usual to hack.i've got a list of pending things to do but can't decide what to do next, here's my list in (sort of) priority order...fix up...
semi supervised naive bayes for text classification
February 14, 2010 at 09:46 PM | categories: Uncategorized
experiment 13; a test of semi supervised naive bayes for text classification is complete.semi supervised algorithms seem to work pretty well and i can see how they are a huge benefit for text classification where you can have an enormous...
e12.3 stat syns FAIL!
February 05, 2010 at 08:31 PM | categories: Uncategorized
after quite a bit of hacking the statistical synonyms idea doesn't seem to give terribly interesting results so i'm going onto do something else.for the record here's what I did do though....generate 3grams from 800e3 tweetscollect n-grams together that share...
an intro to semi supervised document classification
January 31, 2010 at 02:02 PM | categories: Uncategorized
here's a great lecture from tom mitchell about document classification using a semi supervised version of naive bayes.semi supervised algorithms only require some of the training examples to be labeled and are able to make use of any unlabelled ones,...
e12.2 entity set expansion
January 28, 2010 at 08:18 PM | categories: Uncategorized
i've been doing some reading for my statistical synonyms project and have uncovered a heap of cool papers. most of them are around an idea (from the 1950's!) called the distributional hypothesis that simply states that words that appear in...
e12.1 statistical synonyms
January 23, 2010 at 12:54 PM | categories: Uncategorized
i've had an idea brewing in my head for awhile now seeded by a great talk by peter norvig about statistically approaches to find patterns in data.one thing he alludes to is the generation of synoyms based on n-gram models.the...
a pig screencast
January 17, 2010 at 02:22 PM | categories: Uncategorized
pig demo from Mat Kelcey on Vimeo.based on a talk i gave at work recently...
tweets about cheese
November 15, 2009 at 08:45 PM | categories: Uncategorized
people tweet about all sorts of stuff.sometimes it's really important ground breaking world changing stuff...but most of the time it's ridiculous waste of time stuff like 'i ate some cheese'in fact how much do people actually tweet about cheese?and when...
xargs parallel execution
November 06, 2009 at 09:57 PM | categories: Uncategorized
just recently discovered xargs has a parallelise option!i have 20 files, sample.01.gz to sample.20.gz, each ~100mb in size that i need to run a script overone option iszcat sample*gz | ./script.rb > outputbut this will process the files sequentially on...
e11.3 at what time does the world tweet?
October 28, 2009 at 09:22 PM | categories: Uncategorized
consider the graph below which shows the proportion of tweets per 10 min slot of the day (GMT0)it compares 4.7e6 tweets with any location vs 320e3 tweets with identifiable lat lonssome interesting observations with unanswered questions...the ebb and flow is...
e11.2 aggregating tweets by time of day
October 24, 2009 at 01:02 PM | categories: Uncategorized
for v3 lets aggregate by time of the day, should make for an interesting animationbrowsing the data there are lots of other lat longs in data, not just iPhone: and ÜT: there are also one tagged with Coppó:, Pre:, etc...
e11.1 from bash scripts to hadoop
October 18, 2009 at 02:10 PM | categories: Uncategorized
let's rewrite v1 using hadoop tooling, code is on githubwe'll run hadoop in non distributed standalone mode. in this mode everything runs in a single jvm so it's nice and simple to dev against.in v1 it wasbzcat sample.bz2 | ./extract_locations.pl...
e11.0 tweets around the world
October 16, 2009 at 08:47 PM | categories: Uncategorized
was discussing the streaming twitter api with steve and though i knew about the private firehose i didn't know there was a lighter weight public gardenhose interface!since discovering this my pvr has basically been runningcurl -u mat_kelcey:XXX http://stream.twitter.com/1/statuses/sample.json |\ ...
e10.4 communities in social graphs
October 06, 2009 at 08:05 PM | categories: Uncategorized
social graphs, like twitter or facebook, often follow the pattern of having clusters of highly connected components with an occasional edge joining these clusters.these connecting edges define the boundaries of communities in the social network and can be identified by...
simple statistics with R
October 03, 2009 at 03:43 PM | categories: Uncategorized
i'm learning a new statistics language called R and it's pretty cool.make a vector ...12> c(3,1,4,1,5,9,2,6,5,3,5,8) [1] 3 1 4 1 5 9 2 6 5 3 5 8turn it into a frequency table ...123> table(c(3,1,4,1,5,9,2,6,5,3,5,8))1 2 3 4 5...
do a degree via youtube
October 01, 2009 at 08:40 PM | categories: Uncategorized
i'm amazed by how much great content is on youtube, how could you NOT learn something!?13 x 1hr Statistical Aspects of Data Mining (Stats 202)20 x 1hr Machine Learning...
e10.3 twitter crawl progress
September 29, 2009 at 08:43 PM | categories: Uncategorized
since the twitter api is rate limited it's quite slow to crawl twitter and after a most of a week i've still only managed to get info on 8,000 users. i probably should subscribe to get a 20,000 an hr...
e10.2 tgraph crawl order example
September 21, 2009 at 09:58 PM | categories: Uncategorized
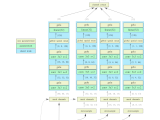
let's consider an example of the crawl order for tgraph...we seed our frontier with 'a' and bootstrap cost of 0.fetching the info for 'a' shows 2 outedges to 'b' and 'c', from our cost formula these all have cost 0...
e10.1 crawling twitter
September 19, 2009 at 09:31 PM | categories: Uncategorized
our first goal is to get some data and the twitter api makes getting the data trivial. i'm focused mainly on the friends stuff but because it only gives user ids i'll also get the user info so i can...
e10.0 introducing tgraph
September 19, 2009 at 02:41 PM | categories: Uncategorized
so e9 sip is on hold for a bit while i kick off e10 tgraph. was looking for another problem to try hadoop with and came across a classic graph one, pagerank. a well understood algorithm like page rank will...
« Previous Page -- Next Page »
popular posts...
FPGA wavenets : eurorack audio processing neural nets running at ~200,000 inferences/sec (oct 2023)

dithernet very slow movie player : a GAN that slowly plays a movie over a year on an eink screen (oct 2020)

evolved channel selection : neural networks robust to any subset of input channels, at any resolution (mar 2021)
ensemble nets : training ensembles as a single model using jax on a tpu pod slice (sept 2020)
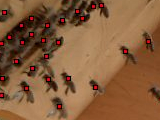
bnn : counting bees with a rasp pi (may 2018)
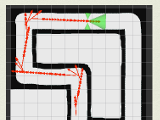
drivebot : learning to do laps with reinforcement learning and neural nets (feb 2016)
wikipedia philosophy : do all first links on wikipedia lead to philosophy? (aug 2011)
some papers from my time at google research / brain...
- Natural Questions: a Benchmark for Question Answering Research
- Using Simulation and Domain Adaptation to Improve Efficiency of Deep Robotic Grasping
- WikiReading: A Novel Large-scale Language Understanding Task over Wikipedia
my honours thesis
the co-evolution of cooperative behaviour (1997) evolving neural nets with genetic algorithms for communication problems.
old projects...
- latent semantic analysis via the singular value decomposition (for dummies)
- semi supervised naive bayes
- statistical synonyms
- round the world tweets
- decomposing social graphs on twitter
- do it yourself statistically improbable phrases
- should i burn it?
- the median of a trillion numbers
- deduping with resemblance metrics
- simple supervised learning / should i read it?
- audioscrobbler experiments
- chaoscope experiment